Biotech pipeline breadth - backtest summary
Pre-registered test run 2026-10-23 · research/biotech/aact_breadth · live paper book
Honest caveats. Backtest 2018-2026 (pre-registered, but an in-sample confirmation: the breadth effect was found in these same years by earlier studies): 12.6% a year after costs vs XBI 6.8% and a size-matched low-breadth control -4.6%; worst fall -61% vs XBI -64%. The edge is mostly 2022-26 (15.7% vs XBI 6.6%); in 2018-21 it was 8.7% vs 7.1% - close to XBI. Quarterly P minus control +4.4% (t 2.9). This paper book is the out-of-sample test. Not investment advice.
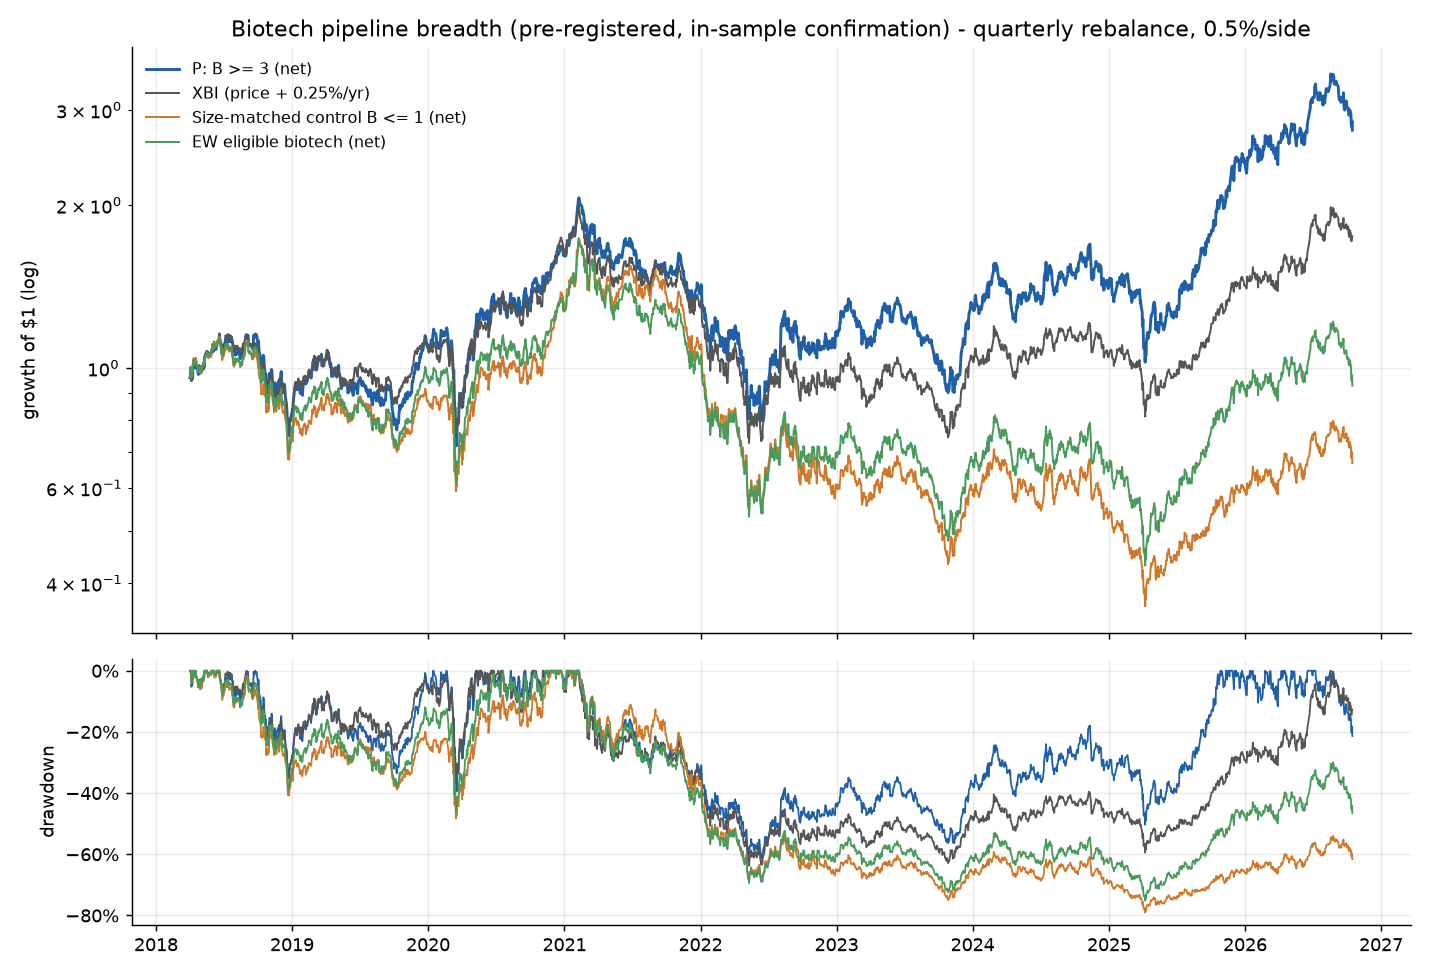
Rules (locked 2026-10-23, backtest): four times a year, at the last trading session of March, June, September and December, count for every eligible US-listed biotech (the research universe; big pharma, CROs and SPAC shells excluded) its pipeline breadth B = the number of its own industry-sponsored, interventional phase 2, 2/3 or 3 trials that are recruiting, active not recruiting, enrolling by invitation or not yet recruiting on ClinicalTrials.gov (latest complete AACT monthly snapshot dated on or before that day). Hold every company with B ≥ 3 in equal weight from the next session's open until the next quarter's rebalance. Costs 0.5% per side on traded dollars; dividends credited; a stock that stops trading (delisting / takeover) becomes cash at its last close. Start $1,000,000. Benchmarks: XBI (price only; its ~0.25%/yr distribution is not added) and SPY total return from the same first open. The first list is the 2026-09-30 one, bought at the open after the book started (2026-10-23).
Results (from results.txt)
[2] PORTFOLIOS (EW at the open after the last session of Mar/Jun/Sep/Dec, buy-and-hold within the quarter, 0.5%/side on traded $, dividends, delisted = cash at last close; daily closes)
  period 2018-04-02..2026-10-16 (2149 sessions); 2018 = from 2018-04-02, 2026 = to 2026-10-16
  portfolio                             CAGR   maxDD Sharpe turn/yr |    18    19    20    21    22    23    24    25    26
  P  B>=3 (PRIMARY)                   +12.6%  -61.3%   0.51    104% |  -18%  +34%  +46%  -15%  -15%  +11%   +8%  +71%  +14%
  P  size-matched control              -4.6%  -79.1%   0.03    185% |  -26%  +18%  +49%  -16%  -44%   -2%  -11%  +13%  +12%
  XBI price+0.25%/yr                   +6.8%  -63.8%   0.36      0% |  -18%  +33%  +48%  -20%  -26%   +8%   +1%  +36%  +23%
  EW eligible universe                 -0.9%  -75.2%   0.15    101% |  -24%  +27%  +32%  -20%  -32%   -4%   -4%  +42%   +1%
  P  before costs (desc.)             +13.8%  -60.9%   0.54    104% |  -17%  +36%  +47%  -14%  -14%  +13%   +9%  +73%  +15%
  P  ctl WITH replacement (desc.)     -10.5%  -83.7%  -0.14    291% |  -31%  +12%  +36%  -21%  -49%  -16%  -11%  +10%  +10%
  XBI price only                       +6.5%  -63.9%   0.36      0% |  -18%  +33%  +48%  -20%  -26%   +8%   +1%  +35%  +23%
  (turn/yr = one-way annual turnover incl. the initial build; the controls / EW pay the same costs)

[3] SUB-PERIODS (CAGR / maxDD / Sharpe)
  2018-21: P  B>=3 (PRIMARY) +8.7% / -40% / 0.42 | P  size-matched control +2.2% / -48% / 0.23 | XBI price+0.25%/yr +7.1% / -37% / 0.37 | EW eligible universe +0.5% / -46% / 0.19
  2022-26: P  B>=3 (PRIMARY) +15.7% / -44% / 0.58 | P  size-matched control -9.7% / -67% / -0.12 | XBI price+0.25%/yr +6.6% / -46% / 0.36 | EW eligible universe -2.0% / -59% / 0.12
  secondaries 2018-21: S1 +3.7% vs ctl -1.6% | S2 +8.9% vs ctl -3.4% | S3 +9.3% vs ctl +0.8% | S4 +4.7% vs ctl -12.6%
  secondaries 2022-26: S1 +13.7% vs ctl -7.4% | S2 +15.7% vs ctl -13.1% | S3 +13.4% vs ctl -11.2% | S4 +3.1% vs ctl -20.3%
Pre-registered pass test
[5] PRE-REGISTERED PASS TEST (primary P = B >= 3)
  2018-21: P +8.7% vs XBI +7.1% -> ok; vs size-matched control +2.2% -> ok
  2022-26: P +15.7% vs XBI +6.6% -> ok; vs size-matched control -9.7% -> ok
  quarterly P-CTL mean +4.40% t +2.94 (need > 0, t >= 2.0) -> ok
  max DD P -61.3% vs XBI -63.8% (P may be at most 10 pts worse) -> ok
  => PASS  (6/6 conditions)

  Reminder: in-sample confirmation (same years in which breadth was found), not an out-of-sample test.
  Secondaries, the before-cost / with-replacement / XBI price-only rows are descriptive. Run time 2s
Data: AACT (ClinicalTrials.gov) monthly snapshots 2017-2026, Massive daily prices, SEC-based biotech universe. P = equal weight of all eligible biotechs with B ≥ 3, quarterly, 0.5%/side. Not investment advice.
No redactions applied.
Published via wiis. Originals are encrypted at rest; this page reflects the redacted version. report abuse.
Discussion
No comments yet.