Sector red-day tilt: buy the hardest-hit large caps (backtest)
The idea: when a large cap's sector ETF (SOXX, IGV, KBE, XLE, IBB, …) falls 3% or more in a day, buy that sector's hardest-hit large caps (weakest fifth that day) at the next open and hold about 6 months (120 trading days). The rest of the portfolio stays in SPY.
Updated 2026-10-21: industry codes now come from SEC filings first (coverage 61% → 97.5% of companies) and shell companies (SPACs) are excluded. Numbers below are the corrected version; the earlier version showed 12.7%/yr for the capped tilt.
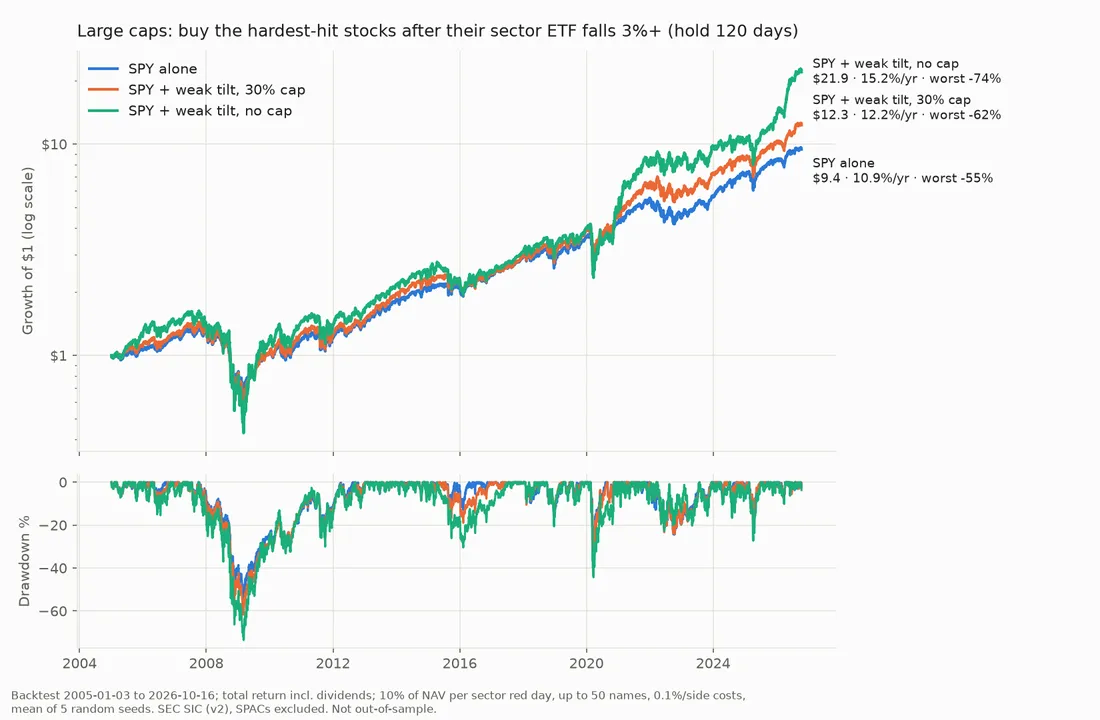
Results, 2005-01 to 2026-10 (total return incl. dividends)
| Per year | 2005-14 | 2015-26 | Worst drop | Sharpe | $1 became | |
|---|---|---|---|---|---|---|
| SPY alone | 10.9% | 7.7% | 13.6% | -55% | 0.64 | $9.4 |
| SPY + weak tilt, 30% cap | 12.2% | 8.5% | 15.4% | -62% | 0.64 | $12.3 |
| SPY + weak tilt, no cap | 15.2% | 9.7% | 20.1% | -74% | 0.62 | $21.9 |
How the portfolio works: on each sector red day, 10% of the portfolio moves from SPY into up to 50 of that sector's hardest-hit large caps (equal weight, next-day open, 0.1% cost per trade). Each position is held 120 trading days, then goes back to SPY. 30% cap = at most 30% of the portfolio is in these trades at once; further signals are skipped until older positions return to SPY. Without the cap, crisis periods pile up signals and the portfolio ends up almost fully in beaten-down stocks (hence the -74% drop in 2008-09).
Year by year
| Year | SPY | 30% cap | No cap |
|---|---|---|---|
| 2005 | +5.3% | +10.1% | +23.0% |
| 2006 | +15.8% | +14.8% | +17.0% |
| 2007 | +5.1% | +3.8% | -3.2% |
| 2008 | -36.8% | -40.7% | -48.5% |
| 2009 | +26.4% | +31.7% | +63.0% |
| 2010 | +15.1% | +23.1% | +22.7% |
| 2011 | +1.9% | -2.0% | -5.6% |
| 2012 | +16.0% | +16.4% | +19.5% |
| 2013 | +32.3% | +36.7% | +34.0% |
| 2014 | +13.5% | +15.2% | +16.0% |
| 2015 | +1.3% | -0.8% | -8.9% |
| 2016 | +12.0% | +7.9% | +7.7% |
| 2017 | +21.7% | +20.5% | +23.9% |
| 2018 | -4.6% | +0.0% | +0.4% |
| 2019 | +31.2% | +32.7% | +29.6% |
| 2020 | +18.4% | +17.5% | +21.2% |
| 2021 | +28.7% | +42.9% | +71.0% |
| 2022 | -18.2% | -11.9% | -1.7% |
| 2023 | +26.2% | +26.9% | +20.6% |
| 2024 | +24.9% | +16.3% | +3.7% |
| 2025 | +17.7% | +19.1% | +29.5% |
| 2026 YTD | +12.8% | +22.0% | +66.7% |
Event-level evidence (12,207 trades)
- Hardest-hit large caps vs all large caps hit the same sector red day: +2.5% after 60 days, +5.4% after 120 days on average; the typical (median) trade only about half a percent.
- Positive in 2005-14 and 2015-26, in both random company halves (tuning +5.7%, hidden +4.3% at 120 days), in 17 of 22 years; removing any single crisis episode keeps it positive.
- The mirror case fails: the stocks that held up best on the red day did worse.
- Small caps fail: the average looks good, but the typical hardest-hit small cap lags.
- Versus buying every large cap hit on the red day (not just the weakest), the weakest-fifth pick adds about 0.8 points a year in the capped portfolio.
Caveats (read before trusting it)
- Not out-of-sample. Same stocks and years used to find it; 1 pass out of 12 decisions in this study (36 across its versions) and over 300 tests in the research series. The 60-day result is borderline statistically.
- Much of the gain comes from crisis rebounds (2009, 2021, 2025-26). The capped version beats SPY by 1.4 points a year with the same Sharpe ratio, but a deeper worst drop (-62% vs -55%).
- Sector = industry ETF mapped from SEC SIC codes (one current code per company); ETF prices with distributions. Costs 0.1% per side; results are the mean of 5 random seeds.
Next step: track it live as a paper-only portfolio before using real money.
No redactions applied.
Published via wiis. Originals are encrypted at rest; this page reflects the redacted version. report abuse.
Discussion
No comments yet.